2008:Audio Chord Detection Results
Contents
Introduction
These are the results for the 2008 running of the Audio Chord Detection task set. For background information about this task set please refer to the 2008:Audio Chord Detection page.
Task Descriptions
Task 1 (Pretrained Systems) Go to Task 1 Results: Systems were pretrained and they were tested against 176 Beatles songs.
Task 2 (Train-Test Systems) Go to Task 2 Results: System trained on ~2/3 of the beatles dataset and tested on ~1/3. Album filtering was applied on each train-test fold such that the songs from the same album can not appear in both train and test sets simultaneously.
Overlap score was calculated as the ratio between the overlap of the ground truth and detected chords and ground truth duration. Also a secondary overlap score was calculated by ignoring the major-minor variations of the detected chord (e.g., C major == C minor, etc.).
Note that 4 songs were excluded from the original Beatles dataset because of alignment of ground truth to the audio problems. The ground truth to audio alignment was done automatically. The script to perform the alignment is going to be released soon by Chris Harte.
General Legend
Team ID for ChordPreTrained (Task 1)
BP = J. P. Bello, J. Pickens
KO = M. Khadkevich, M. Omologo
KL1 = K. Lee 1
KL2 = K. Lee 2
MM = M. Mehnert
PP = H.Papadopoulos, G. Peeters
PVM = J. Pauwels, M. Varewyck, J-P. Martens
RK = M. Ryynänen, A. Klapuri
Team ID for ChordTrainTest (Task 2)
DE = D. Ellis
ZL = X. Jhang, C. Lash
KO = M. Khadkevich, M. Omologo
KL = K. Lee (withtrain)
UMS = Y. Uchiyama, K. Miyamoto, S. Sagayama
WD1 = J. Weil
WD2 = J. Weil, J-L. Durrieu
Overall Summary Results
Task 1 Results
Task 1 Overall Results
| TeamID | BP | KL1 | KL2 | KO | MM | PP | PVM | RK |
|---|---|---|---|---|---|---|---|---|
| Avg. Overlap Score | 0.66 | 0.56 | 0.59 | 0.62 | 0.65 | 0.63 | 0.59 | 0.64 |
| Avg. Overlap Score (Merged maj/min) | 0.69 | 0.6 | 0.65 | 0.65 | 0.68 | 0.66 | 0.62 | 0.69 |
| TeamID | BP | KL1 | KL2 | KO | MM | PP | PVM | RK |
|---|---|---|---|---|---|---|---|---|
| Run Time(sec) | 2059 | 853 | 827 | 2832 | 5580 | 6100 | 7411 | 1634 |
Task 1 Summary Data for Download
File Name Set (Pretrained runs)
Summary Overlap Data (Pretrained runs)
Summary Overlap Data (Pretrained runs (Merged maj/min))
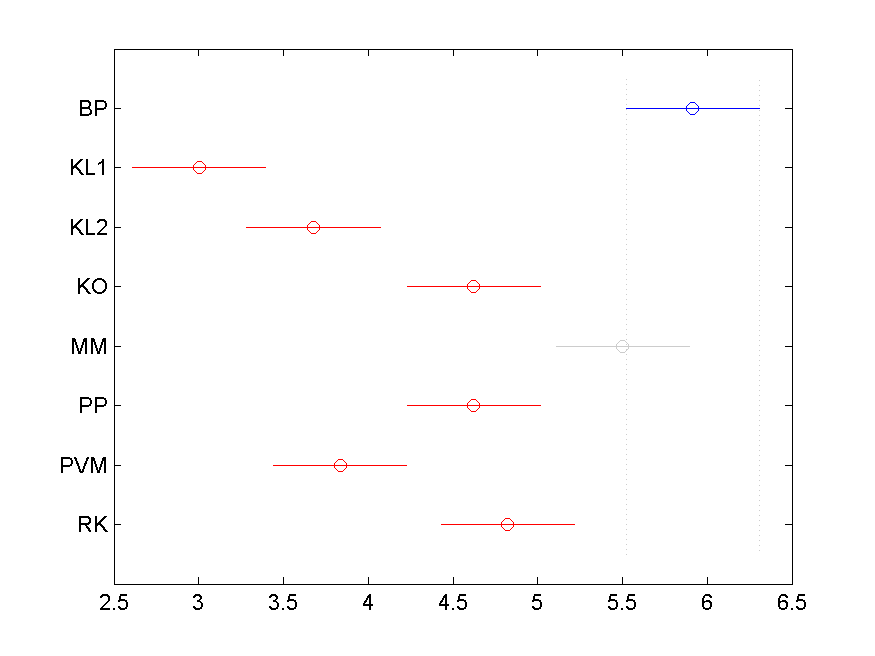
Task 1 Friedman's Test for Significant Differences
The Friedman test was run in MATLAB against the Task 1 Overlap Score data over the 176 ground truth songs.
| Source | SS | df | MS | Chi-sq | Prob>Chi-sq |
|---|---|---|---|---|---|
| Columns | 1180.83 | 7 | 168.69 | 196.83 | 0 |
| Error | 6210.17 | 1225 | 5.07 | ||
| Total | 7391 | 1407 |
The Tukey-Kramer HSD multi-comparison data below was generate using the following MATLAB instruction.
Command: [c,m,h,gnames] = multcompare(stats, 'ctype', 'tukey-kramer', 'estimate', 'friedman', 'alpha', 0.05);
| TeamID | TeamID | Lowerbound | Mean | Upperbound | Significance |
|---|---|---|---|---|---|
| BP | KL1 | 2.1575 | 2.9489 | 3.7402 | TRUE |
| BP | KL2 | 1.4814 | 2.2727 | 3.0641 | TRUE |
| BP | KO | 0.7598 | 1.5511 | 2.3425 | TRUE |
| BP | MM | -0.3681 | 0.4233 | 1.2147 | FALSE |
| BP | PP | 0.4842 | 1.2756 | 2.0669 | TRUE |
| BP | PVM | 1.2996 | 2.0909 | 2.8823 | TRUE |
| BP | RK | 0.2371 | 1.0284 | 1.8198 | TRUE |
| KL1 | KL2 | -1.4675 | -0.6761 | 0.1152 | FALSE |
| KL1 | KO | -2.1891 | -1.3977 | -0.6064 | TRUE |
| KL1 | MM | -3.3169 | -2.5256 | -1.7342 | TRUE |
| KL1 | PP | -2.4647 | -1.6733 | -0.8819 | TRUE |
| KL1 | PVM | -1.6493 | -0.8580 | -0.0666 | TRUE |
| KL1 | RK | -2.7118 | -1.9205 | -1.1291 | TRUE |
| KL2 | KO | -1.5129 | -0.7216 | 0.0698 | FALSE |
| KL2 | MM | -2.6408 | -1.8494 | -1.0581 | TRUE |
| KL2 | PP | -1.7885 | -0.9972 | -0.2058 | TRUE |
| KL2 | PVM | -0.9732 | -0.1818 | 0.6095 | FALSE |
| KL2 | RK | -2.0357 | -1.2443 | -0.4530 | TRUE |
| KO | MM | -1.9192 | -1.1278 | -0.3365 | TRUE |
| KO | PP | -1.0669 | -0.2756 | 0.5158 | FALSE |
| KO | PVM | -0.2516 | 0.5398 | 1.3311 | FALSE |
| KO | RK | -1.3141 | -0.5227 | 0.2686 | FALSE |
| MM | PP | 0.0609 | 0.8523 | 1.6436 | TRUE |
| MM | PVM | 0.8763 | 1.6676 | 2.4590 | TRUE |
| MM | RK | -0.1862 | 0.6051 | 1.3965 | FALSE |
| PP | PVM | 0.0240 | 0.8153 | 1.6067 | TRUE |
| PP | RK | -1.0385 | -0.2472 | 0.5442 | FALSE |
| PVM | RK | -1.8539 | -1.0625 | -0.2711 | TRUE |
Task 2 Results
Task 2 Overall Results
| TeamID | DE | KL | KO | UMS | WD1 | WD2 | ZL |
|---|---|---|---|---|---|---|---|
| Avg. Overlap Score | 0.66 | 0.58 | 0.55 | 0.72 | 0.60 | 0.62 | 0.36 |
| Avg. Overlap Score (Merged maj/min) | 0.70 | 0.65 | 0.58 | 0.77 | 0.66 | 0.69 | 0.46 |
| TeamID | DE | KL | KO | UMS | WD1 | WD2 | ZL |
|---|---|---|---|---|---|---|---|
| Run Time (s) | 6294 | 2745 | 4824 | 22593 | 3816 | 145812 | 7020 |
Task 2 Summary Data for Download
File Name Set (Train-test runs)
Summary Overlap Data (Train-test runs)
Summary Overlap Data (Train-Test runs (Merged maj/min))
Per Fold Summary Data (Train-Test runs (Zip archive))
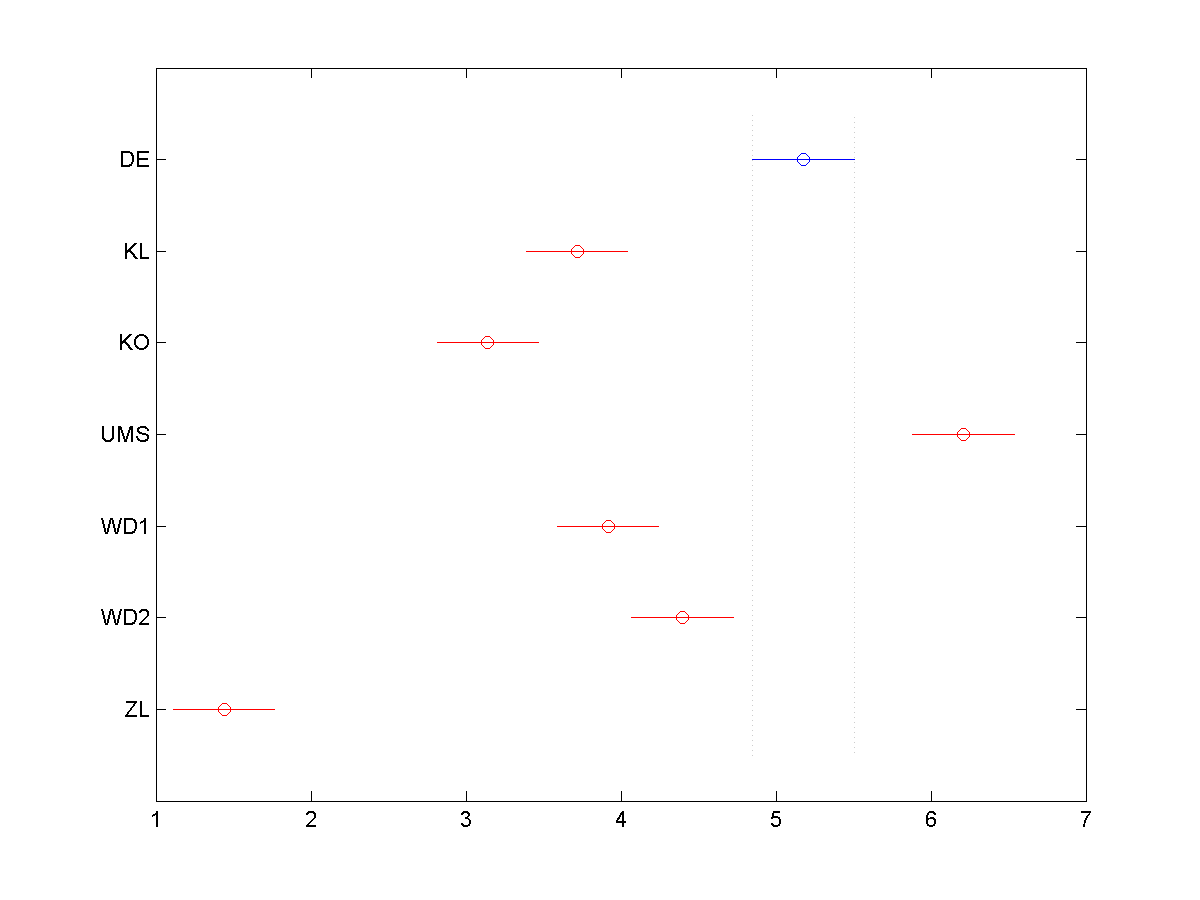
Task Friedman's Test for Significant Differences
The Friedman test was run in MATLAB against the Task 2 Overlap Score data over the 176 ground truth songs.
| Source | SS | df | MS | Chi-sq | Prob>Chi-sq |
|---|---|---|---|---|---|
| Columns | 2596.95 | 6 | 432.825 | 562.85 | 0 |
| Error | 2607.55 | 1122 | 2.324 | ||
| Total | 5204.5 | 1315 |
The Tukey-Kramer HSD multi-comparison data below was generate using the following MATLAB instruction.
Command: [c,m,h,gnames] = multcompare(stats, 'ctype', 'tukey-kramer', 'estimate', 'friedman', 'alpha', 0.05);
| TeamID | TeamID | Lowerbound | Mean | Upperbound | Significance |
|---|---|---|---|---|---|
| DE | KL | 0.8069 | 1.4601 | 2.1133 | TRUE |
| DE | KO | 1.3840 | 2.0372 | 2.6904 | TRUE |
| DE | UMS | -1.6851 | -1.0319 | -0.3787 | TRUE |
| DE | WD1 | 0.6074 | 1.2606 | 1.9138 | TRUE |
| DE | WD2 | 0.1287 | 0.7819 | 1.4351 | TRUE |
| DE | ZL | 3.0862 | 3.7394 | 4.3926 | TRUE |
| KL | KO | -0.0761 | 0.5771 | 1.2303 | FALSE |
| KL | UMS | -3.1452 | -2.4920 | -1.8388 | TRUE |
| KL | WD1 | -0.8527 | -0.1995 | 0.4537 | FALSE |
| KL | WD2 | -1.3314 | -0.6782 | -0.0250 | TRUE |
| KL | ZL | 1.6261 | 2.2793 | 2.9325 | TRUE |
| KO | UMS | -3.7223 | -3.0691 | -2.4159 | TRUE |
| KO | WD1 | -1.4298 | -0.7766 | -0.1234 | TRUE |
| KO | WD2 | -1.9085 | -1.2553 | -0.6021 | TRUE |
| KO | ZL | 1.0489 | 1.7021 | 2.3553 | TRUE |
| UMS | WD1 | 1.6394 | 2.2926 | 2.9458 | TRUE |
| UMS | WD2 | 1.1606 | 1.8138 | 2.4670 | TRUE |
| UMS | ZL | 4.1181 | 4.7713 | 5.4245 | TRUE |
| WD1 | WD2 | -1.1319 | -0.4787 | 0.1745 | FALSE |
| WD1 | ZL | 1.8255 | 2.4787 | 3.1319 | TRUE |
| WD2 | ZL | 2.3042 | 2.9574 | 3.6106 | TRUE |

